


- Joined
- Apr 22, 2010
- Messages
- 3,129
- Reaction score
- 1,082
- Points
- 7,215
Good people.
I come to you with a great concern. One that speaks directly to what I believe and will show below to have been plaguing the tech review industry for years. Like all ills, this speaks to a minority of websites, as the vast majority at least in the capacity of content creators, are upright, transparent and reliable. However, something has caught my attention and I would appreciate your sober and objective opinion on it. I must say first, that I come to you because; believe it or not - you are the keepers, watchers of the entire industry. Your consistent effort, drive and intense competitive spirit is what keeps you at the bleeding edge of desktop computing technology. In essence, competitive overclocking is the Formula 1 of consumer computing as I have many times written. At any point where a claim is made, one has to balance that against what one sees here on HWBOT. Results that have been scrutinized and verified by many and can for the most part be confirmed and repeated. Before I go further, please note that I have explicit trust in the scientific method and its rigorous methods of inquiry. Any theory, philosophy or claim, must make reliable predictions, offer a coherent picture, have repeatable results and most importantly must be falsifiable and open to scrutiny. So here goes.
1. On the 11th of June 2015, the website, GURU3D.com, published a review of the following graphics card, the GIGABYTE GV-N98TG1 GAMING-6GD, or better stated, the GeForce GTX 980Ti G1.GAMING. That review can be found here Gigabyte GeForce GTX 980 Ti G1 Gaming SOC Review - Introduction
2. The test system upon which the results were generated are briefly stated as:
- MSI X99S XPower AC
- Intel Core i7 5960X @ 4.4GHz (on all eight cores)
- GeForce GTX 980Ti – Gigabyte G1 Gaming (In “OC Mode” as per OC GURU Software setting)
- 16GB (4x 4096MB) 2133MHz DDR4
- CORSAIR AX1200i PSU
- Windows 8.1 64-bit
- DirectX 9/10/11/12 End User Runtime
- NVIDIA GeForce series latest 353.12
The above may be found on Page 12 Gigabyte GeForce GTX 980 Ti G1 Gaming SOC Review - Test Environment & Equipment of the review
3. The author supposedly recorded these results in both synthetic and game play benchmarks. I am going to focus on the synthetic tests, mainly 3DMark (the latest edition) and second to that 3DMark11. Reason being; these are common tools for measuring performance and they provide reliable and consistent results. Here are the results briefly of this review
- 3DMark 11 P23,363
- 3DMark 11 X9,378
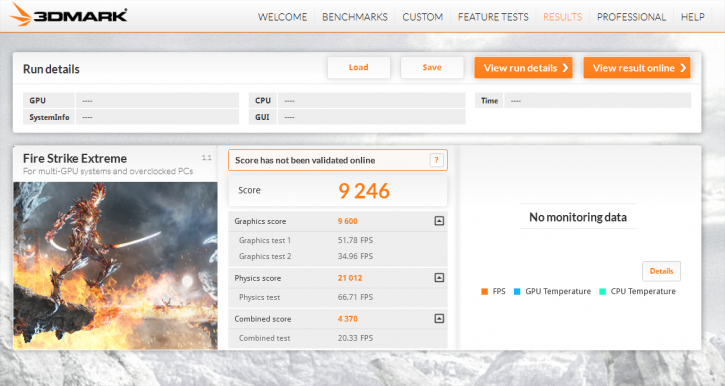
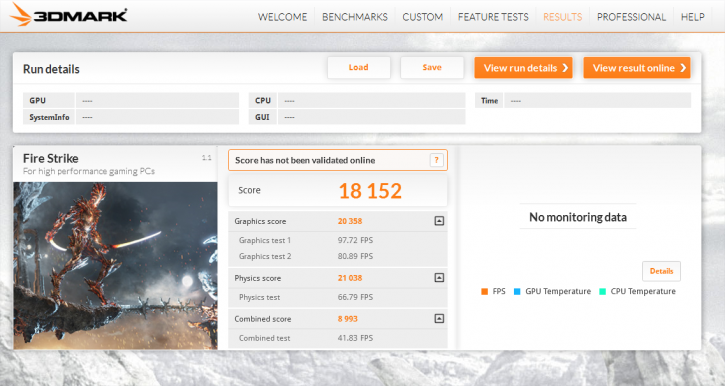
- 3DMark Firestrike18,152
- 3DMark Firestrike Extreme9,246
I have attached pictures of the website at the time of publication showing these scores. Author has since updated the 3DMark results in both Firestrike and Firestrike extreme.
This images will no longer be found on the current review as it was changed. Oj0 and I have since been banned for trolling. This is the link to the original review page in PDF Format
4. These results naturally became suspect as they did not in any way show the kind of performance I was experiencing with an Identical graphics card. Consistently the system I was testing on scored lower in three benchmarks listed above and substantially so in the latest 3DMark Concerning especially since these are the settings I use for testing.
- - GIGABYTE X99 SOC-Champion (F4i) which was later switched to the MSI X99A Xpower AC
- - Intel Core i7 5960X @ 4.5GHZ (45x100) | 4000MHz Uncore (40x100)
- - Gigabyte GeForce GTX 980Ti G1.Gaming SOC (The identical GPU as the one under review)
- - CORSAIR DDR4 3200MHz (4x4GiB) @ 3200MHZ CL16-18-18-36-2T
- - CORSAIR AX1500i PSU
- - Windows 8.1 64-bit (always updated) and Windows 7 SP1 64-bit (for consistency checking with Press Kit results)
- - NVIDIA GeForce series latest 353.12 driver (as downloaded from Guru3D.com)
My results are as follows with the verification links and pictures under
- - 3DMark 11 P23,577 – NVIDIA GeForce GTX 980 Ti video card benchmark result - Intel Core i7-5960X,MSI X99A XPOWER AC (MS-7881)
- - 3DMark 11 X8,969 – NVIDIA GeForce GTX 980 Ti video card benchmark result - Intel Core i7-5960X,MSI X99A XPOWER AC (MS-7881)
- - 3DMark Firestrike– P17,696 – http://www.3dmark.com/fs/5084194
- - 3DMark Firestrike ExtremeX8849 – http://www.3dmark.com/fs/5084134
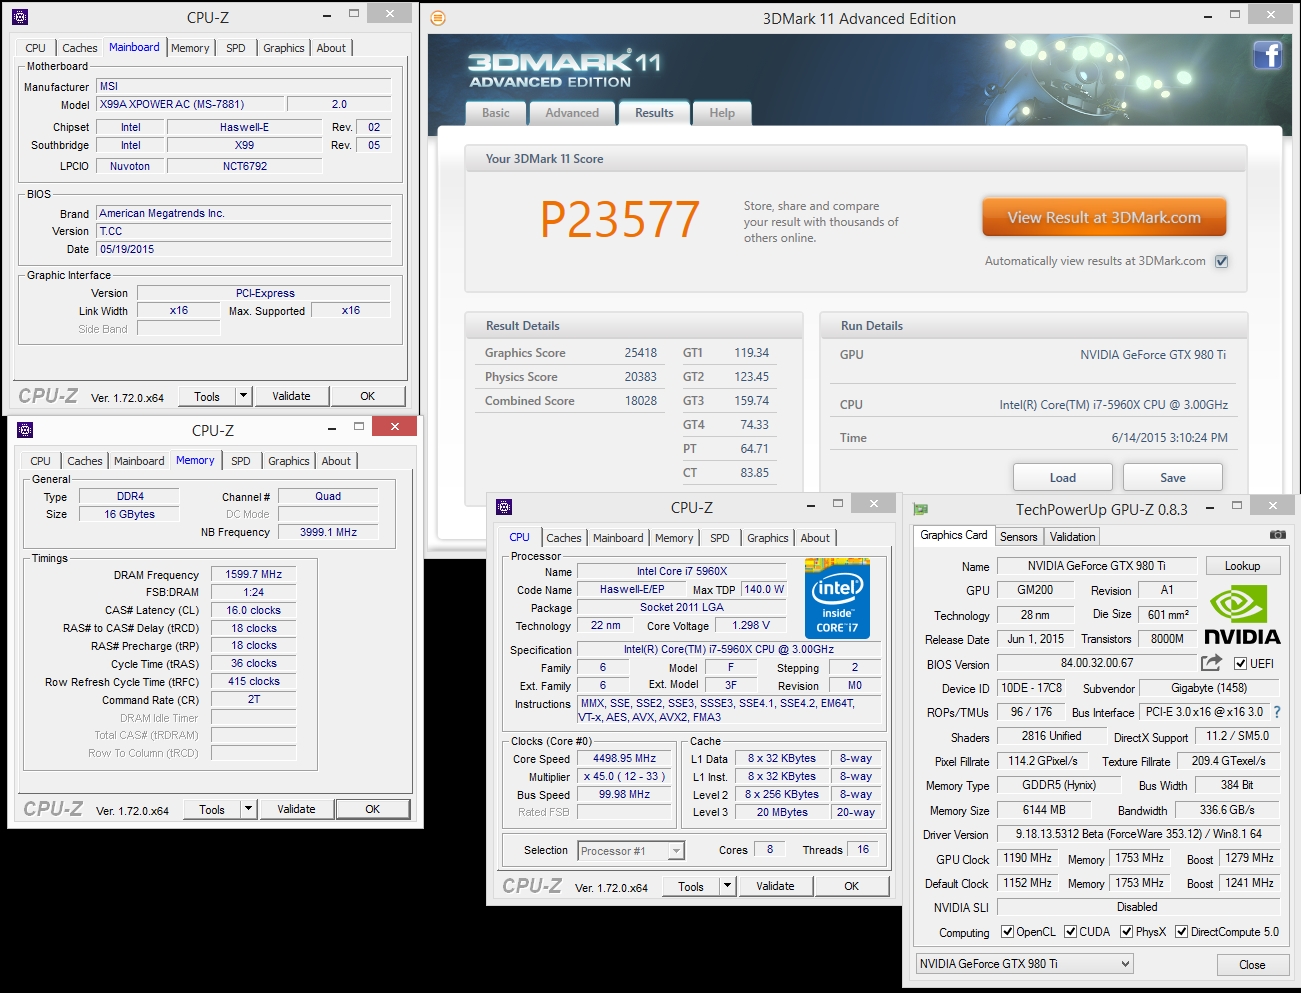
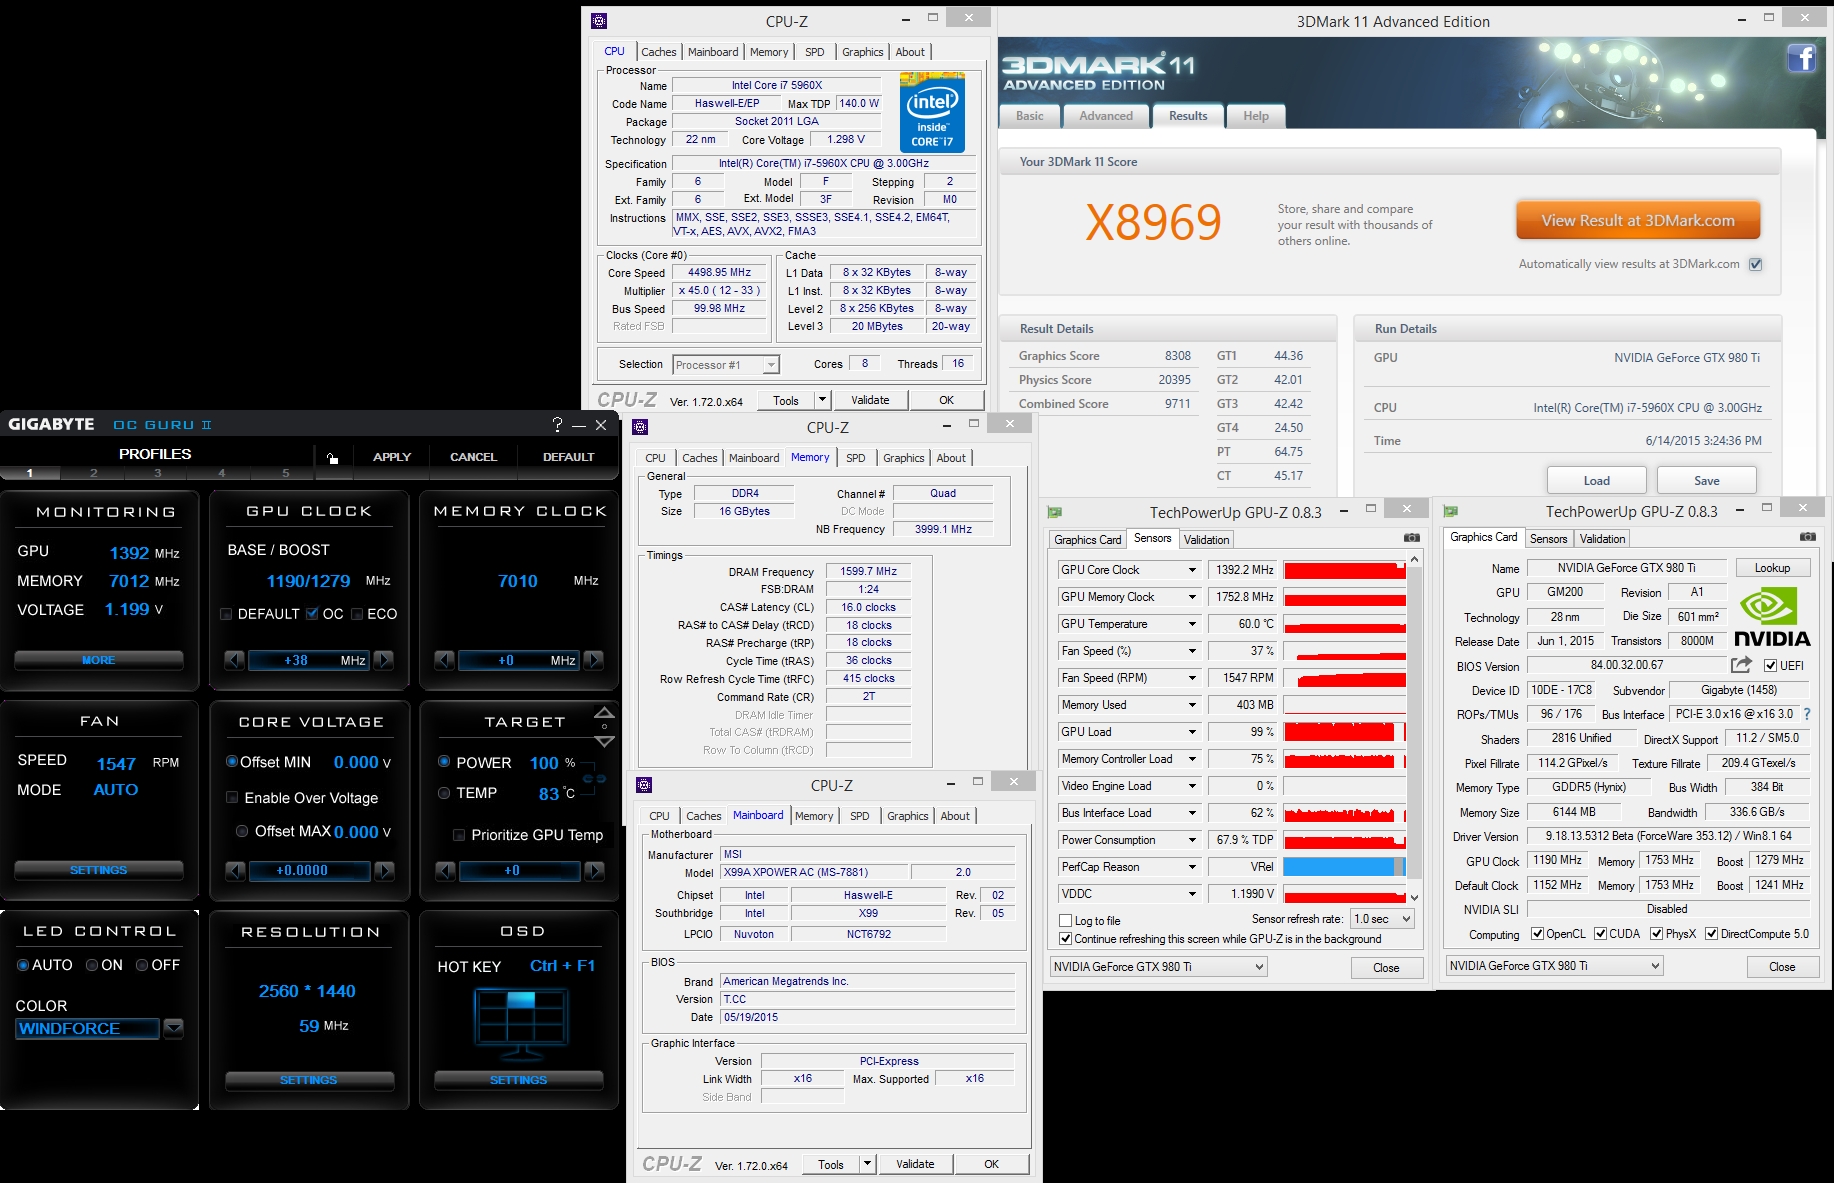
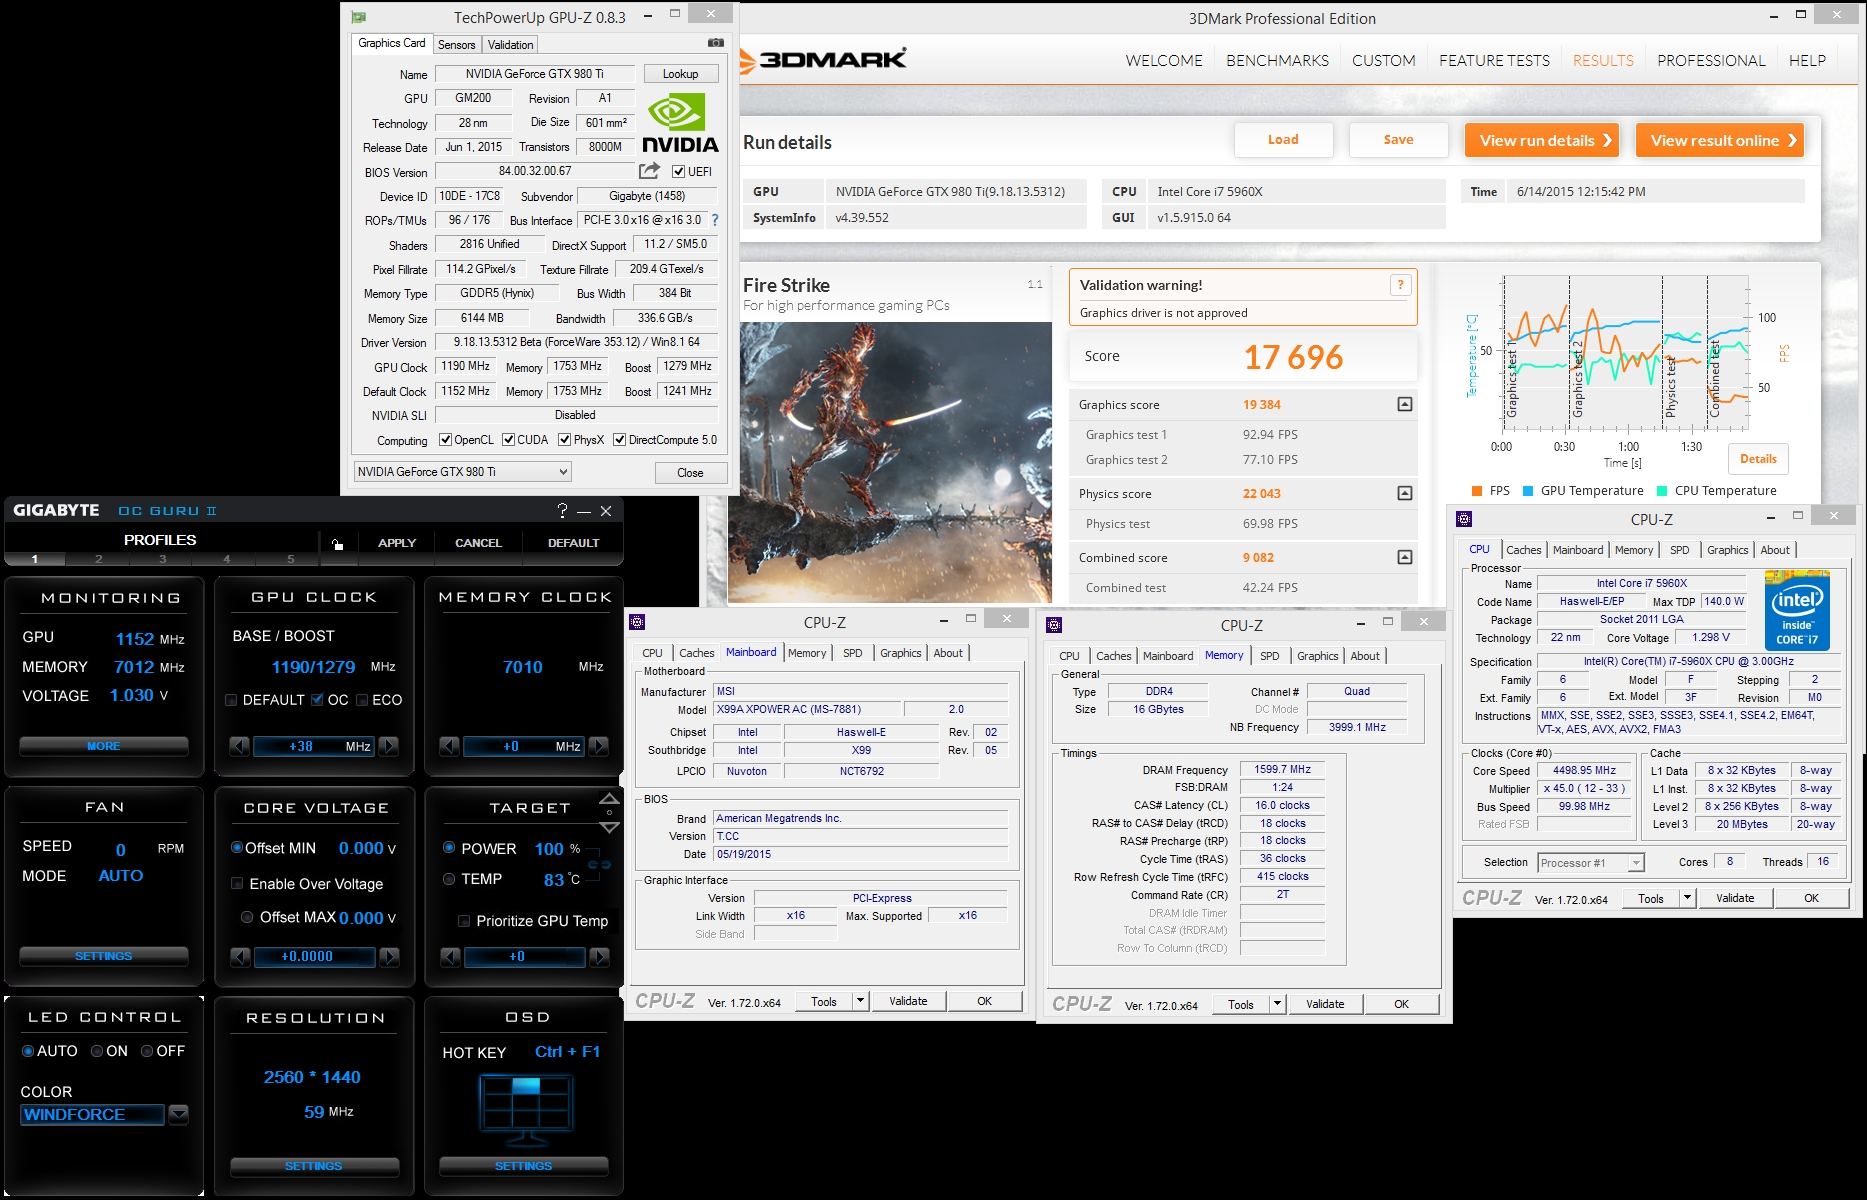
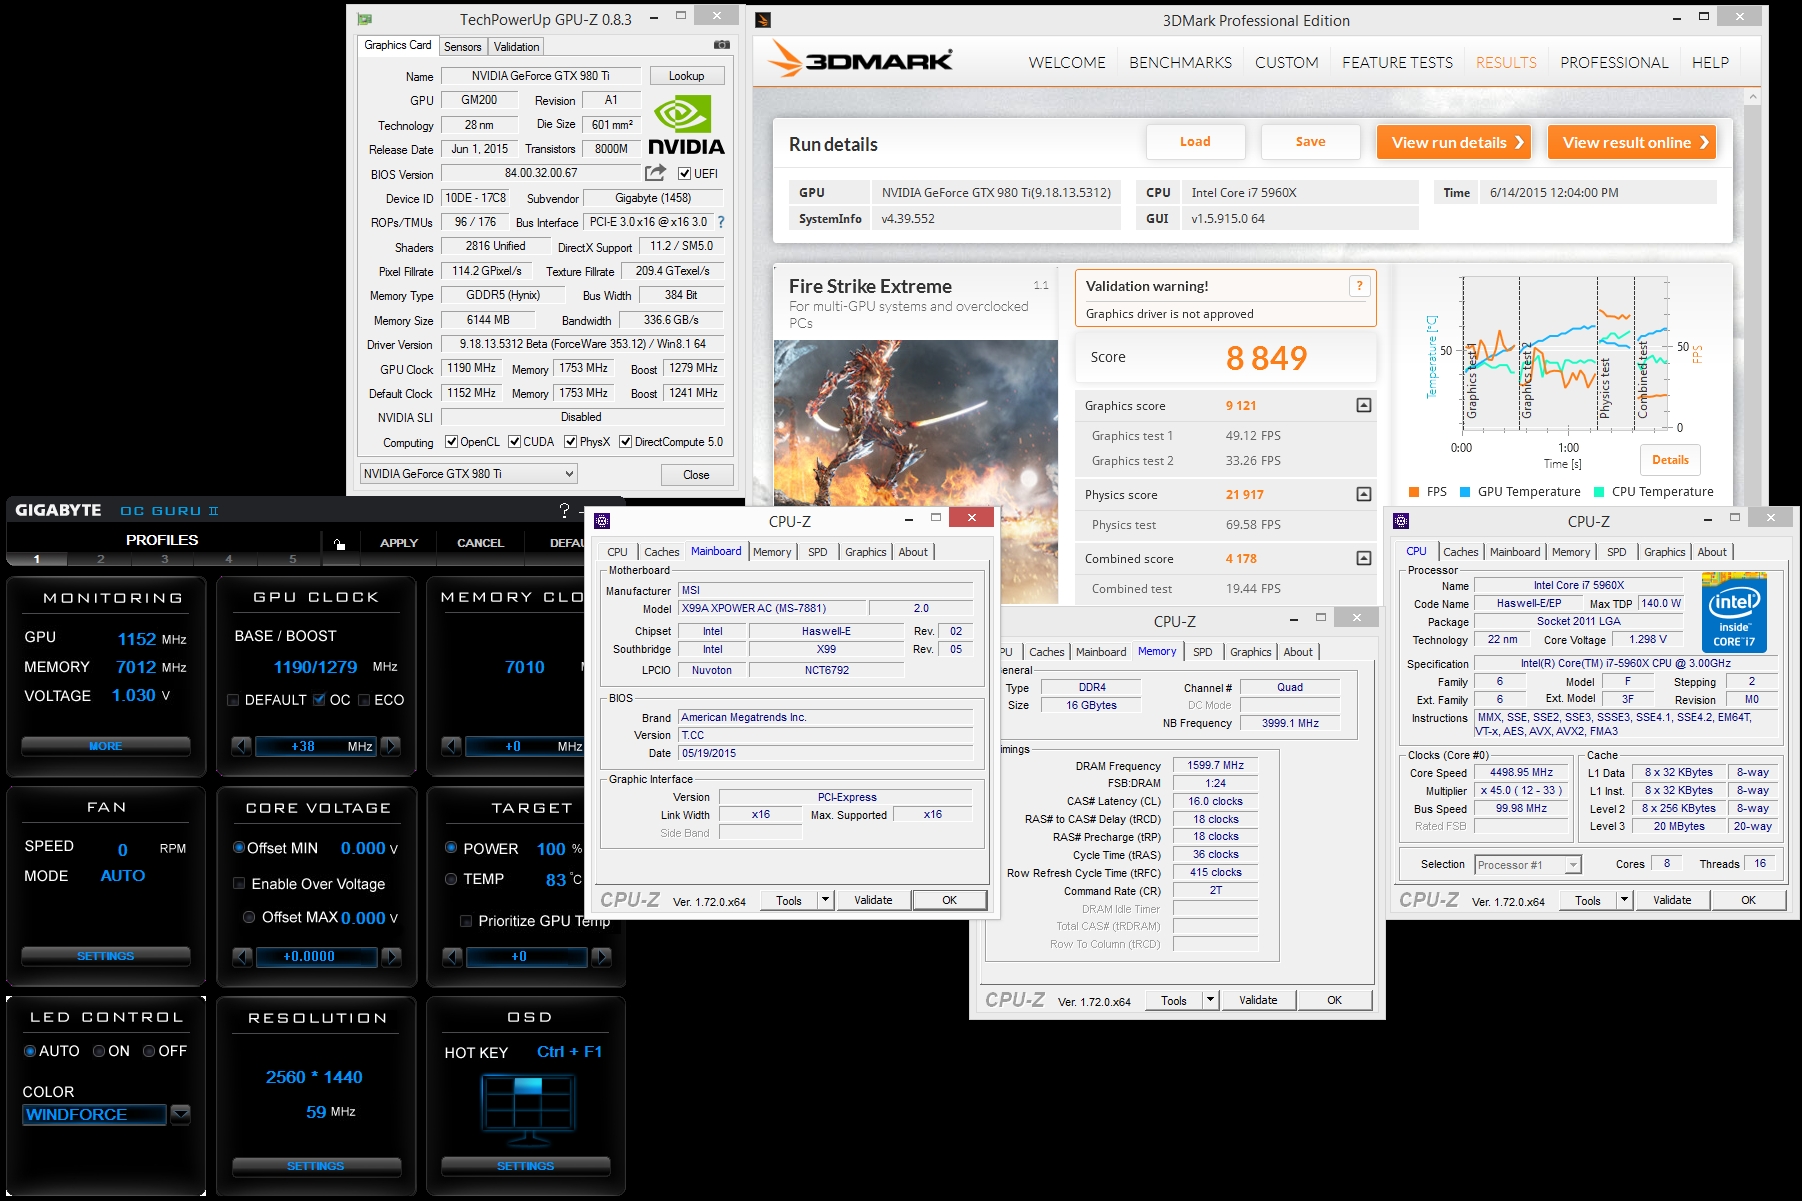
You can clearly see that despite, both GPUs operating at the identical OC mode (1190MHz base clock and 1291MHz boost clock), my results are consistently lower than the ones reported on GURU3D, barring 3DMark11’s performance test. Even though the host system being faster as made evident by the Physics scores. The GPU scores are substantially lower. His Firestrike Graphics score is 20,358 compared to my 19,384. Nearly 1,000 points between the two at supposedly factory OC-Mode. Firestrike Extreme shows his GPU score at 9,600 while mine is 9,121
You may have to only focus on 3DMark Firestrike and Firestrike visual validations as that is the only thing we have to go by here other than the writer's word.
The system that should be faster or score higher is scoring lower, consistently. The differences in GPU scores are remarkable, with the Graphics sub scores in each case (where visible) higher than the ones I am able to achieve. This difference is not within the margin of error, but as you know, consistent with a higher overclock.
However, since it is possible for the efficiency of my system perhaps for some reason or another to be particularly low. I proceeded to test my results against what the Press deck from GIGABYTE has as a reference results. The picture attached is from the PDF press deck.
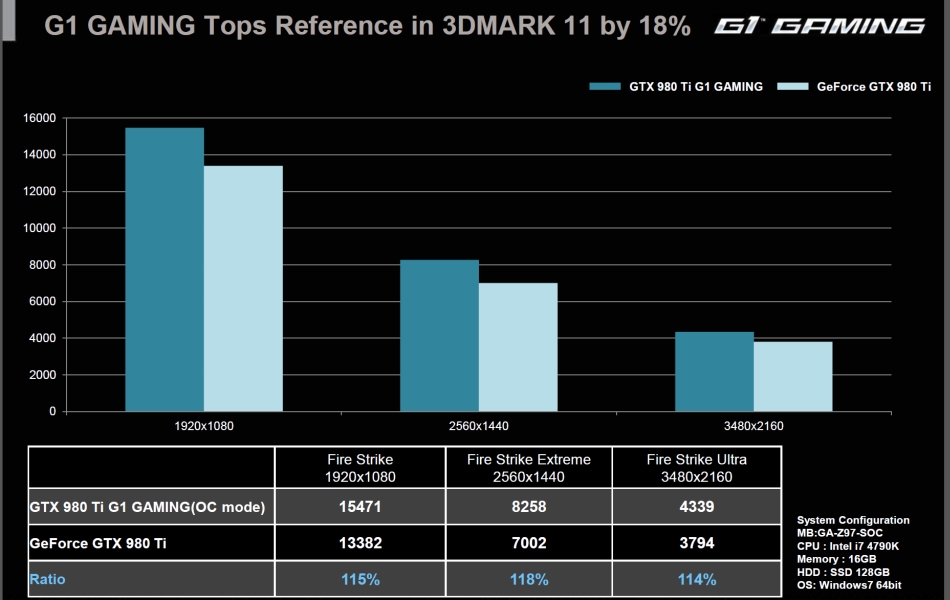
I proceeded to configure my system in a way (via UEFI) to make use of only four cores (HT was kept on however). CPU clock set to 4GHz, two sticks of memory removed (to simulate dual-channel setup as with the 4790K) while everything else remained the same. As you can tell, the scores reproduced are in line with the press deck. So perhaps, both the GIGABYTE test environment and my test environment have equally poor efficiency compared to what GURU3D reports.
- 8235 Vs the Press Deck 8256 in FireStrike Extreme in Windows 7 x64 (new installation)
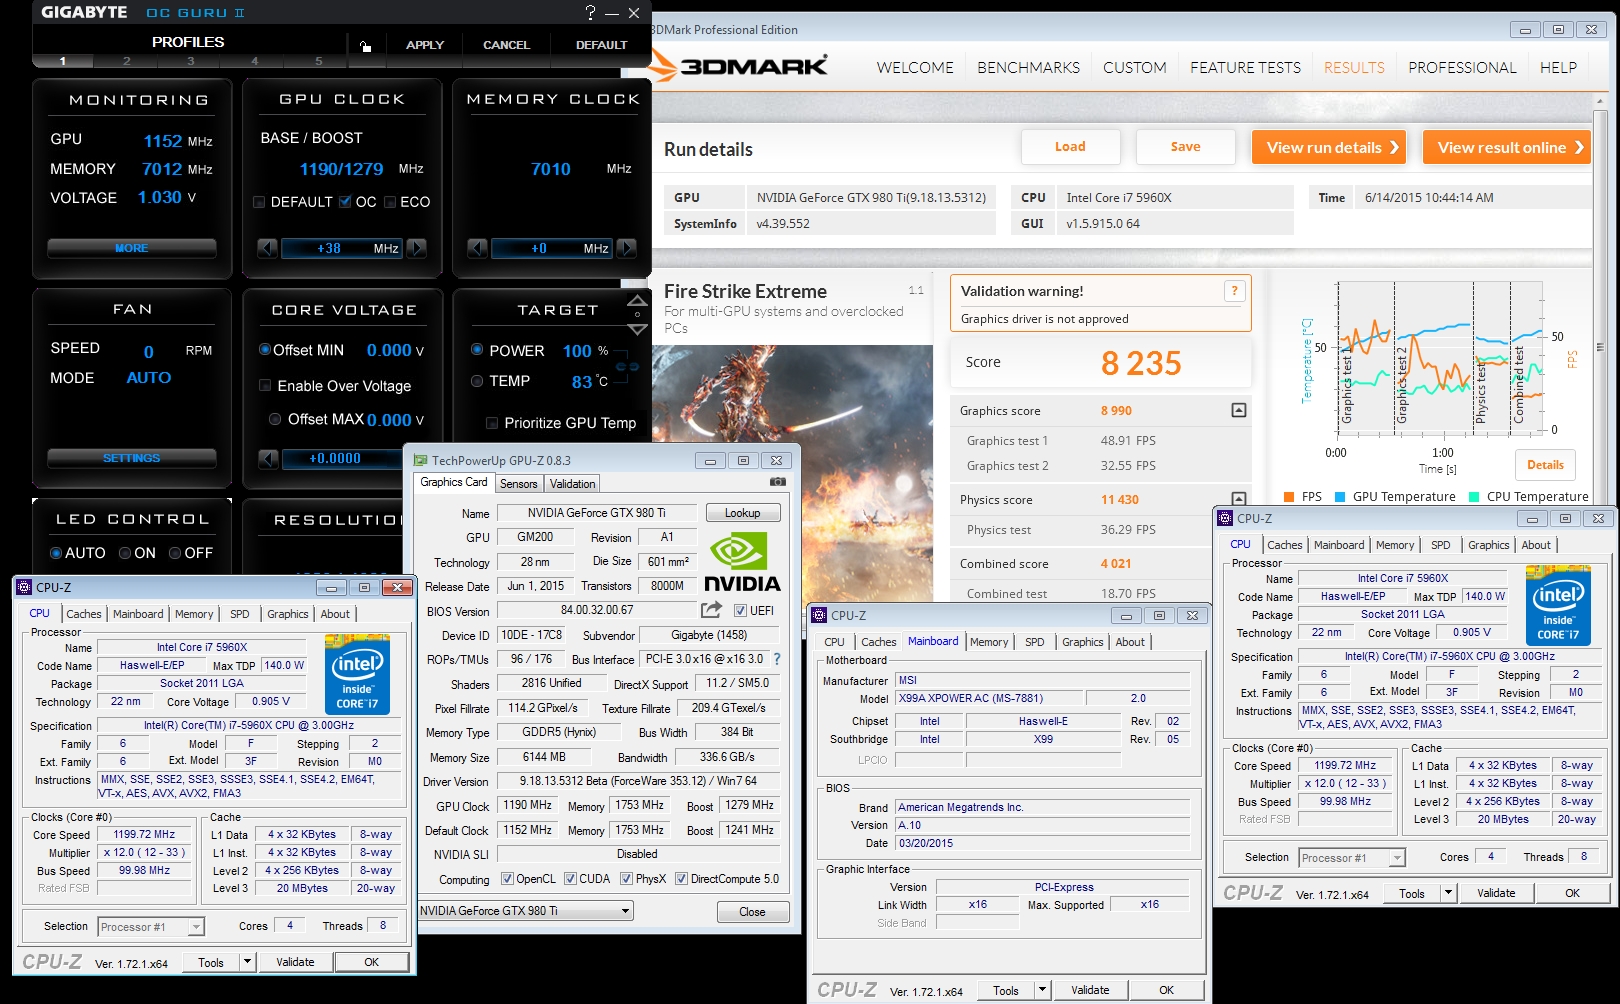
Clearly, there is some parity between the press deck numbers and what I am able to achieve. If anything, the results are within the margin of error.
We then move on to the supposed overclocking results on Page 36 of the GURU3D review. As per his suggestion, I used his identical settings, highlighted in the picture below. The Boost clock on my G1.Gaming 980Ti happens to be even higher than what he suggests the actual boost clock would be. His claim is that some titles will dip as low as 14522MHz ~ 1477MHz, but as high as 1,555MHz. Since this will vary per card, mine ends up at 1529MHz and is relatively consistent at that. GPU-Z reports 1302MHz, much like on his table for Core clock when overclocked. Using the following settings.
- • Temp Target 85 Degrees C
- • CPU clock +150 MHz (from default 1152 MHz)
- • Mem clock +375 MHz
- • Voltage + 50Mv
- • FAN RPM 55% (recommended but a little more is noisy)
To verify the results again, I proceeded to run 3DMark FireStrike in accordance with the configuration he claims, which is again. A 4.4GHz CPU clock, a DRAM frequency of 2133MHZ and what we assume to be an UNCORE clock left at AUTO (At any rate it would not be over 3,500MHz as it is not possible or at least highly improbable on the motherboard he is using).
These were my results, emulating his test environment and manual OC above.
3DMark Firestrike – 19097 (His)
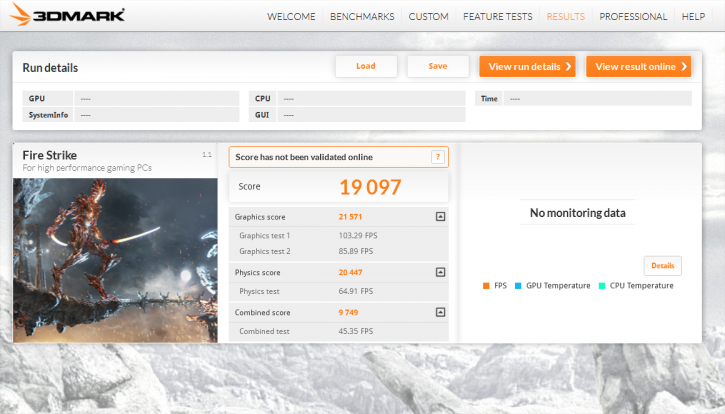
3DMark Firestrike – 18897 (mine) – http://www.3dmark.com/3dm/7330499
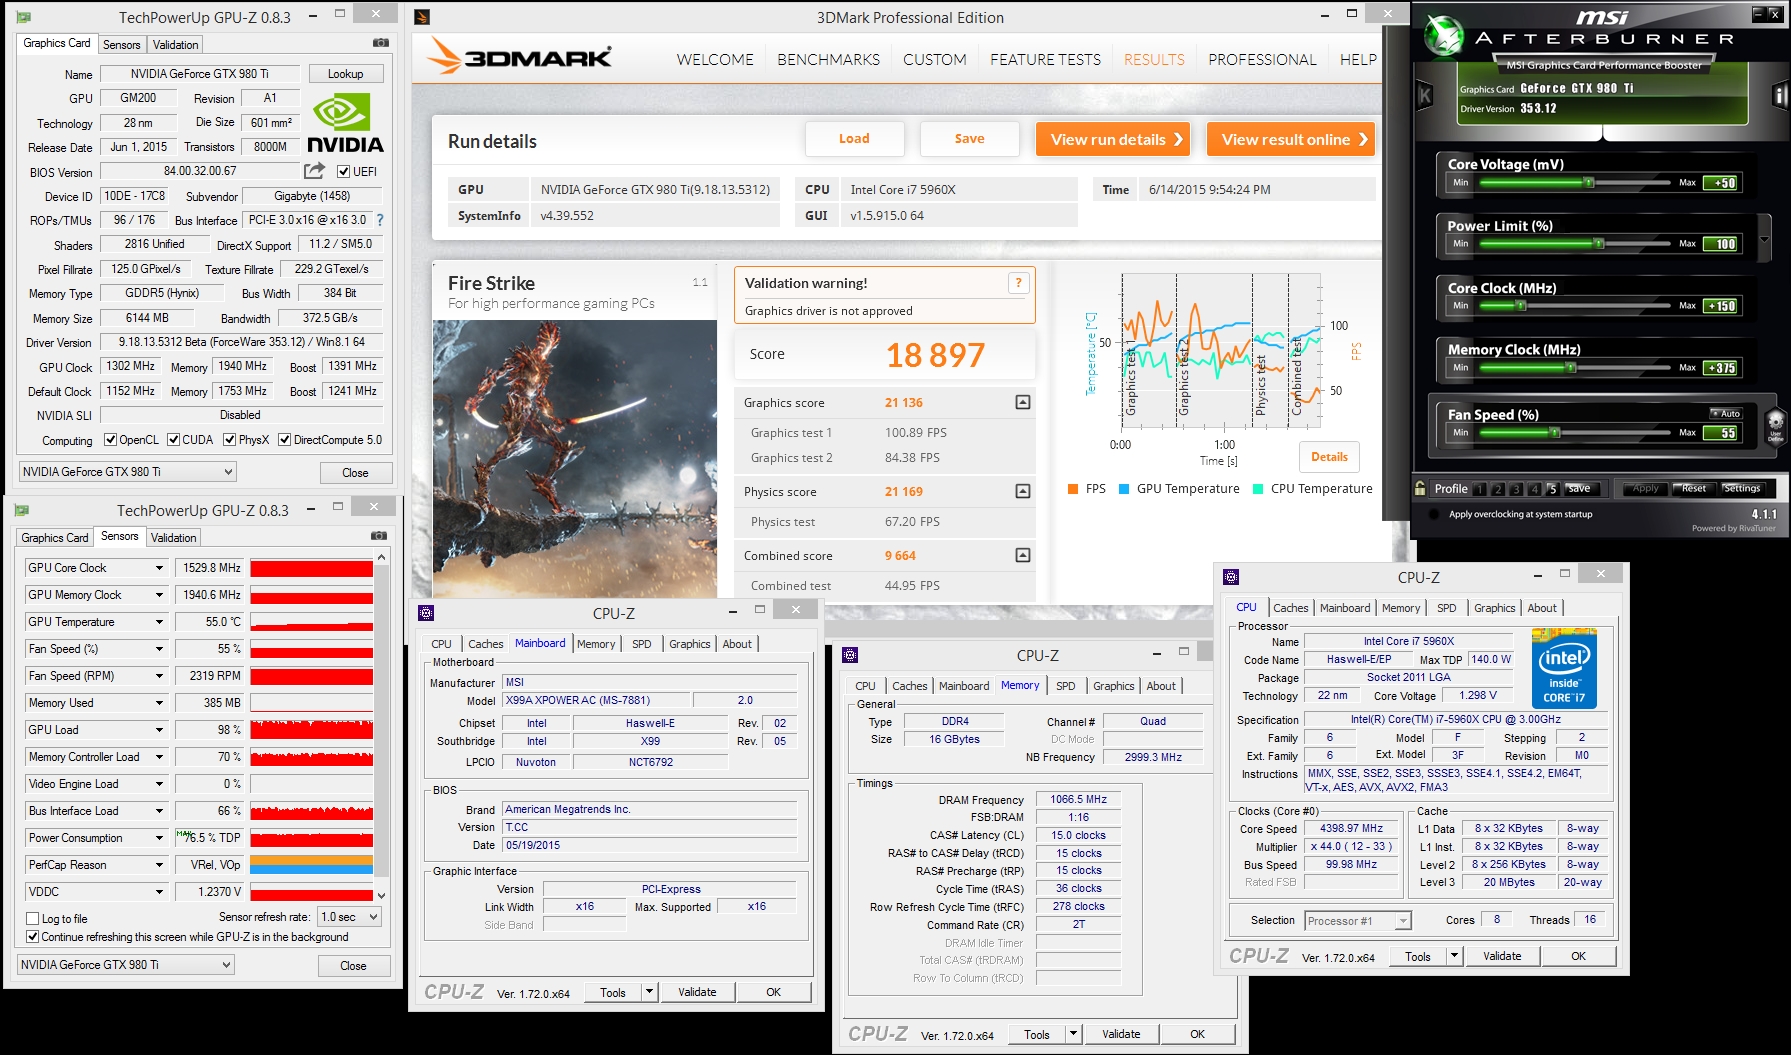
Again, my Physics score even when emulating his system is higher at 21,169 vs. his 20, 447. Yet for some inexplicable reason his Graphics Score is 21,571 vs. my 21,136
Good people
I will then present to you some more evidence, which if anything should raise your levels of suspicion.
Prior to this review, on 1 June 2015. GURU3D published a review on the reference NVIDIA GTX 980 Ti. I would like to bring to your attention, page 24/URL] where you will find screenshots of the 3DMark runs for that review.
You will note that in the screenshots, SystemInfo is running and able to verify that the score is indeed from an NVIDIA GTX 980Ti on a system powered by the Core i7 5960X. Compare that review with the review that is under scrutiny where the SystemInfo has been disabled. Thus there’s no way verify that this system was indeed running a Geforce GTX 980Ti, let alone which model. So from just the previous review, to this one (in almost two weeks), SystemInfo needs to be disabled, when the test system has not changed? Why?
Upon inquiry as to why this was done, this is what the author stated.
This is particularly odd because there is nothing that could be shown by SystemInfo that would be under NDA, especially since the test system has already been listed and apparently hasn't changed from the last review.“Validation is disabled in my benchmarks as we review a lot of embargo stuff that we do not want to see online. “
Naturally the thread at GURU3D, with all of this has been edited and offending posts including mine and from the other individual, Oj.overclock.Me, have been removed. Fortunately, he had the foresight to save these pages prior to the deletion. You may at your leisure download the original thread prior to editing [URL="https://app.box.com/s/q7u5u2frw7fvcupiiom698iq0wfp2jxn"]here.
If you have managed to read this far, I thank you. I leave it up to you, to have your say on this matter. As I truly do believe that these results were fabricated, possibly in several ways. Efforts have been made by the author at GURU3D to produce unreliable numbers. Furthermore to obfuscate any inquiry into this and discussion, two individuals were banned in an attempt to silence them.
Finally. I want to take you back to the original 3DMark Firestrike score of 9,246 with a Graphics score of 9,600. The first thing I saw that made me suspect this entire review. It is, exactly what betrays the falsehood of it all.
The beauty of having a 3DMark Professional/Advanced licence is that you can easily track your GPU, and GPU memory clocks during the duration of any run. However, you can't if you disable SystemInfo. As I do no such thing, in the name of transparency. I bring you the following picture.
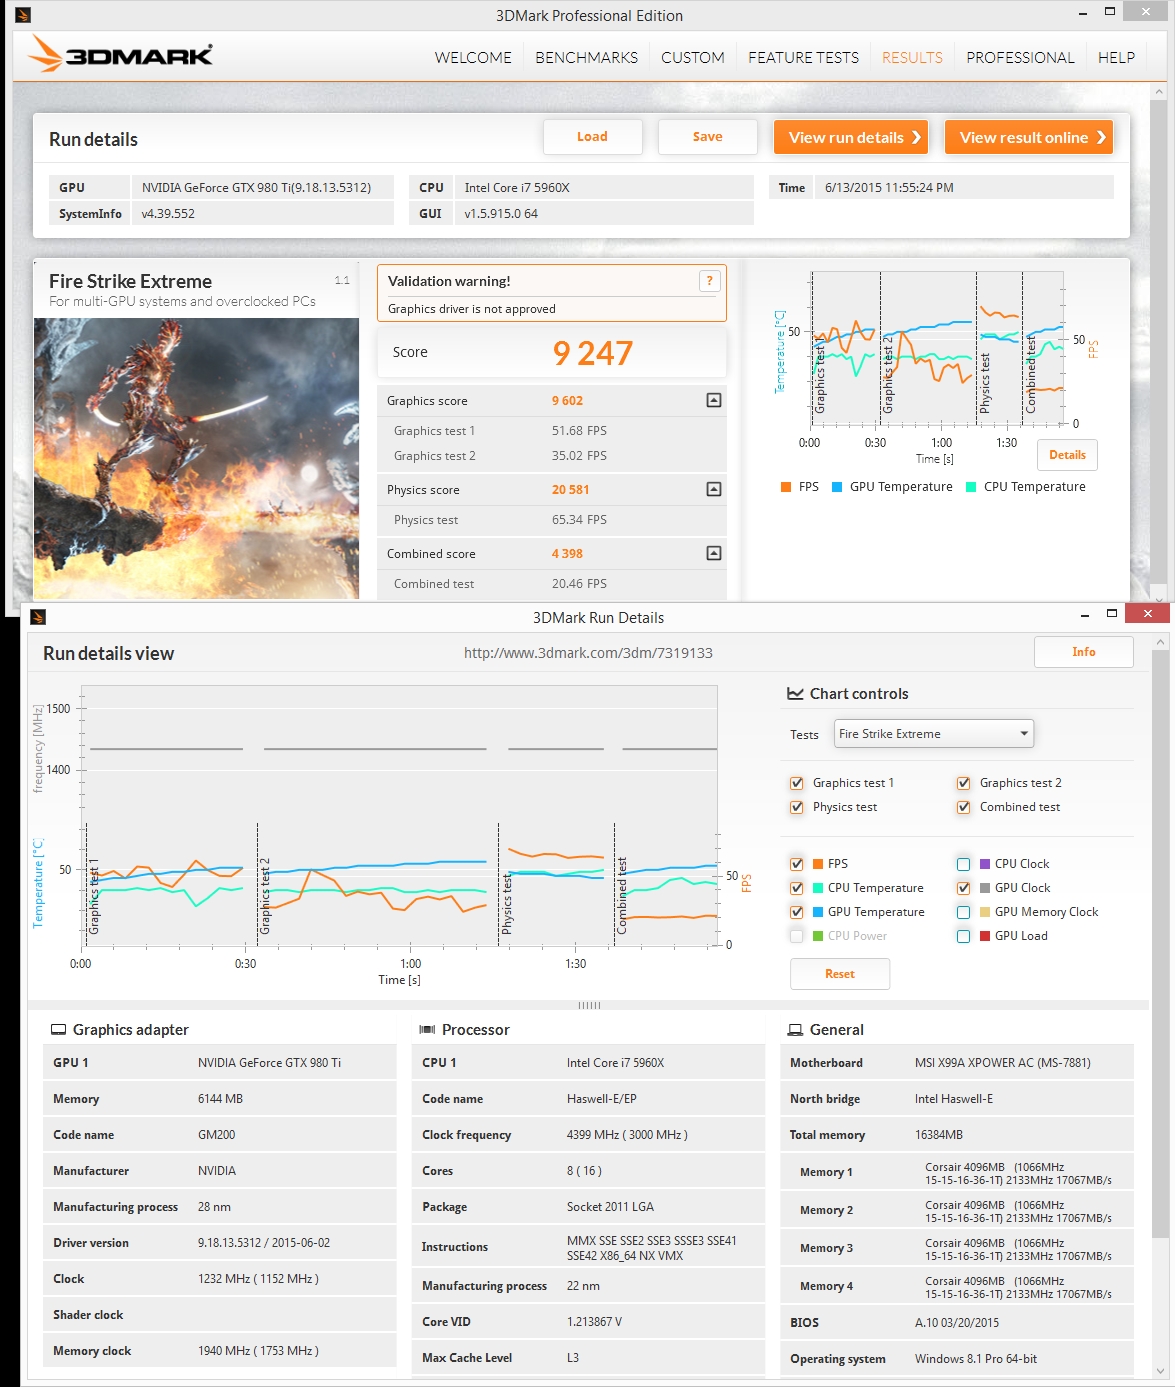
9,247!
Let's talk about getting close to a score, well there it is.
GPU score 9,602 Just two points higher than his!
As we have seen the Physics sub-score in this test is of little to no consequence (hence the Author's ability to run a system that scores almost 1,500 points lower in Physics scores but still achieve a higher overall score. If you will, it is entirely GPU bound)
Pay close attention and you will see, that the grey dotted line above the others, is the GPU Clock. It is consistent and always above 1400MHz, in fact to be exact it is 1434.1MHz throughout the entire test. What of the memory? Well look to the bottom left of the image under Graphics adapter. You will see a memory clock of 1940MHz which is 7,760MHz 760MHz more than the stock memory frequency.
Last edited by a moderator: